
West Antarctic Ice Core Chemistry and Self-Organizing Maps: A First Look
David B. Reusch and Richard B. Alley
Department of Geosciences and EMS EESI
The Pennsylvania State University
University Park, PA 16802
Paul A. Mayewski
Department of Earth Sciences and Climate Change Institute
University of Maine
Orono, ME 04469
dbr@geosc.psu.edu
Self-organizing maps (SOMs) are a tool for analysis of variability in large, multivariate and/or multidimensional datasets. The technique provides a complementary nonlinear alternative to more frequently used but linear tools such as empirical orthogonal function (EOF) analysis. SOMs have a number of advantages including readily handling nonlinear behavior and robust interpolation into areas of the input space not present in the available training input. SOMs also have the benefit of being a completely independent uniformitarian analysis pathway and thus provide independent results for comparison with more traditional techniques.
In short, SOM training develops a set of generalized patterns from multidimensional input data by projecting the input to a two-dimensional grid and thereby mapping the probability density function of the input to two dimensions. Unlike EOFs, the patterns are not orthogonal and they do not sum to the original data. The size of the grid is problem dependent and determined somewhat subjectively based on the goals of the analysis. Larger (smaller) grids do less (more) generalization. The grid also has an inherent spatial structure such that similarity between patterns decreases with distance in the grid. This structure leads to opposite patterns being located in the diagonal corners of the SOM grid. While these pattern pairs will not necessarily be mirror images, they often represent a (possibly nonlinear) axis of variability. Once training is complete, each data record maps to a single closest matching SOM pattern. Further analysis of the data often focuses on how these mappings change over time or space, e.g., frequency maps.
A SOM analysis (using a 5x4 grid with 20 patterns, Figure 1) has been started on the Holocene (~20 - 11,200 ybp) portion of the Siple Dome A core major ion chemistry record (Meyerson et al, in review) to explore this dataset from a nonlinear, SOM-based perspective. Two general behaviors are identified by the analysis: high versus low values for nearly all species in the corner patterns on one diagonal and a high NO3/SO4, low NO3/SO4 pair on the other diagonal.
Frequency mapping by time slice broadly identifies the first diagonal as the upward trend in concentrations seen in all species through the Holocene. Early (first 2,000 years, low values) and late (last 2,000 years, high values) portions of the record map to patterns in opposite corners of the SOM grid with the corner pattern itself accounting for 43% and 16% of the early and late part of the record, respectively. The early record is fairly tightly mapped with just three (of the 20 available) SOM patterns in its corner accounting for 82% of the data. In contrast, the last 2,000 years of the record is more variable and the data are more spread out over that corner of the SOM grid: the five leading patterns, located in the opposite corner of the grid, account for only 50% of this subset.
Mapping the data associated with a particular SOM pattern versus is another useful analysis. Plotting records from the two high/low values corner patterns versus time confirms, in part, the trend in species concentration seen in the normal time series. The low values pattern is most frequent in the 9,000 - 11,000 ybp range with a secondary peak around 6,500 ybp while the high values pattern appears most frequently during the last ~800 to 1,000 years. The NO3/SO4 low value pattern has a broad peak over the 6,000 - 9,000 ybp range and a secondary peak around 3,000 ybp. The NO3/SO4 high value pattern first appears around 3,000 ybp and continues to present. Although this behavior is intriguing, interpretation of the two NO3/SO4 patterns should be cautious given the relatively few records involved (~200 records or ~7% of the dataset). Similar mapping of the other SOM patterns, in particular the various forms of all/most species high or low, will give further insights to the temporal behavior of this record.
An additional caution appears when mapping the "instrumental era" portion of the record: 70% of the last 80 years of the record (only 32 samples) maps to just 4 SOM patterns clustered in one corner of the SOM grid. This leaves the majority of the record uncalibrated by modern meteorological data and highlights the extrapolation inherent (and necessary) in this type of work.
Further insights are expected when this tool is applied to other ice core chemistry datasets from West Antarctica and nearby regions.
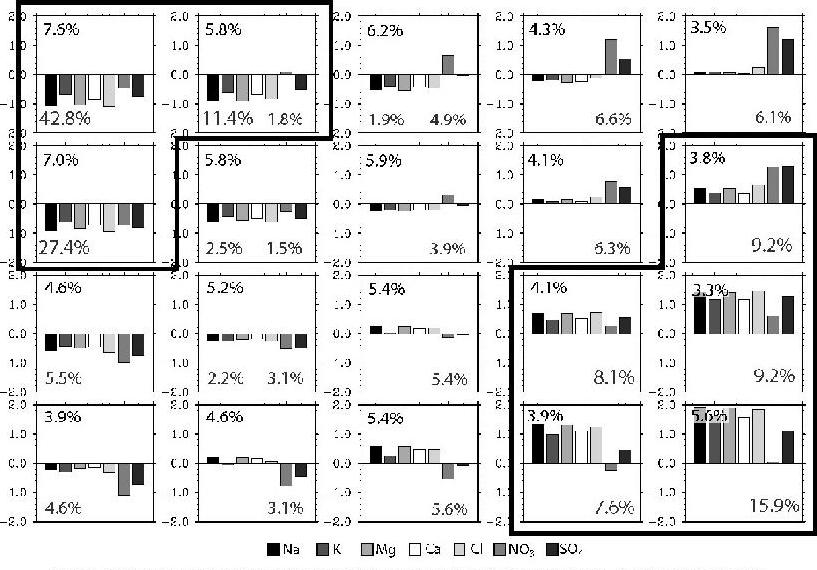 Figure 1. A self-organizing map analysis of Siple Dome major ion chemistry (normalized) for the Holocene. Percentages within each plot are the frequency mapping for the full record (upper left corner), first 2,000 years (lower left corner) and last 2,000 years (lower right corner). Heavy outline at upper left (lower right) surrounds patterns accounting for 82% (50%) of the oldest (youngest) part of the record.